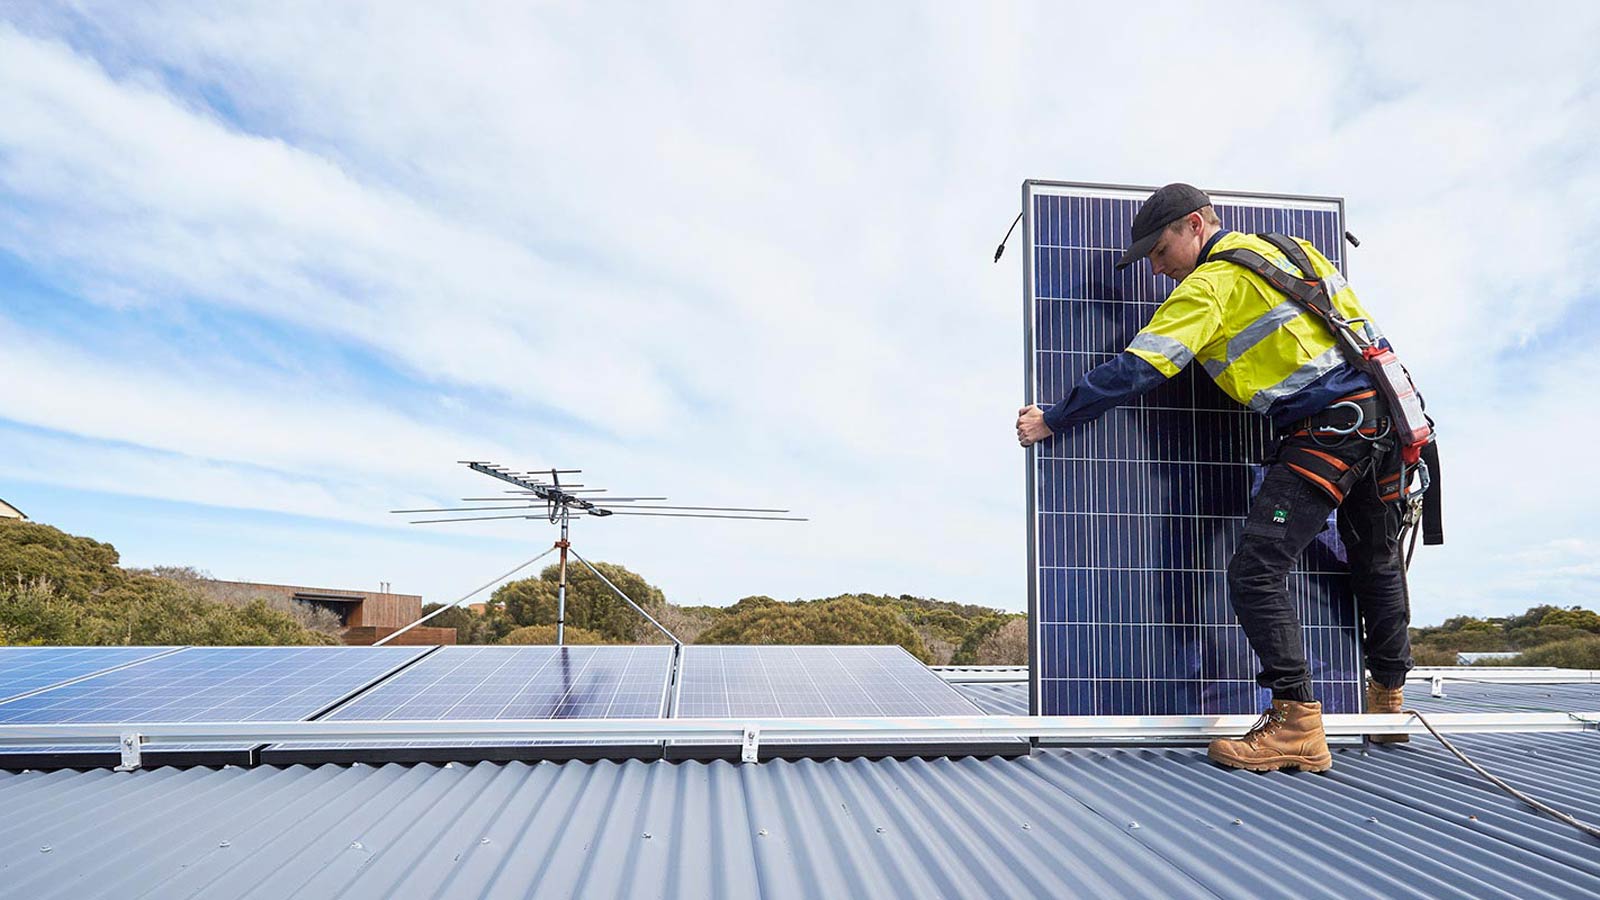
We’ll help you choose the right panels for your roof, from our premium brands.
Compare our solar system packages
6.6kW solar system
8kW solar system
10kW solar system
Our cleaner energy solutions
Why RACV Solar?
How much could going solar save you?
Select your average daily energy usage (kWh) and how much solar capacity you need (kW) to get an estimate of your installation cost and annual savings.
Estimate your daily household energy use
Find your average daily energy usage on your bill. This is measured in kW per hour.
What size solar system is right for you?
Rebates and finance options
Industry memberships and certifications


Need help?
Interested in solar for your business?
Low-risk, high-return commercial solutions to help your business transition to solar and meet your cleaner energy goals, whatever industry you’re in.
You might also be interested in
Advice and tips on home energy solutions
Indicative Pricing:
Calculations are based on the following conditions: single-storey properties, single-phase electrical systems, tin roofing, grid electricity rate estimate $0.30, Feed in Tariff $0.05, installations without split arrays, and no requirement for additional works such as switchboard upgrades.
Prices are inclusive of GST, federal Small-scale Technology Certificates (STCs), and the Solar Victoria solar panel rebate, which is valued at $1,400 for solar panel systems. Eligibility criteria apply for the Solar Victoria rebate.
Limitations:
The results provided by this calculator are to be used as a guide only.
Actual savings, system performance, and costs can vary based on numerous factors not considered by this calculator, including but not limited to, weather patterns, shading, system age, and component efficiency.
For advice tailored to your specific needs please get in touch for a tailored quote.
**3.99% p.a. and 8.40% p.a. comp. rate is based on a $30,000 loan for 5-year loan period. See the comparison rate warning on www.plenti.com.au. All applications for credit are subject to approval. Terms, conditions, fees and charges apply. Credit provided by Plenti Finance Pty Limited ACN 636 759 861 (supported by its servicer, Plenti RE Limited ACN 166 646 635) or Perpetual Corporate Trust Limited ACN 000 341 533, Australian Credit Licence number 392673 (as custodian).


