
From steering wheel locks to OBD port locks and Faraday pouches, the best car security setup combines visible deterrents, electronic protection and practical home security measures.
Car Security
Most stolen cars in Melbourne and regional Victoria
The most stolen cars in Melbourne and Victoria have been revealed in the latest crime data, with several familiar makes and models appearing near the top of the list.
Car theft continues to be an issue in Victoria, with 31,851 vehicles stolen in the year ending March 2026, up from 31,531 in the year ending March 2025, according to Crime Statistics Victoria (CSV).
The latest figures show some notable changes in the models most often reported stolen, with familiar passenger cars, utes and SUVs appearing throughout the list.
This article reveals where car theft is most prevalent, which vehicles are most often targeted, and the practical steps drivers can take to reduce their risk, regardless of make or model.
Unless specified, all statistics in this article are drawn from Crime Statistics Victoria data for the year ending March 2026 and compared with the year ending March 2025.
In this article
The most stolen car in Victoria
Crime Statistics Victoria data revealed the Toyota Corolla was the most stolen car in Victoria, for the year ending March 2026.
The data showed a sharp year-on-year increase, with Corolla thefts rising from 707 to 1,244, a 76 per cent increase.
It was followed by the Holden Commodore, which was the second most stolen car in Victoria. Despite production of the car ceasing in 2020, the Commodore remains a frequent target for thieves, with 1,183 stolen in the year ending March 2026. It also topped Victoria’s list of most targeted cars in the year ending March 2025, with 1,653 incidents.
One factor that may help explain the Commodore’s prominence on the theft list is its continued presence on Victorian roads. Transport Victoria data shows 107,051 Commodores were registered across the state between 1 July and 30 September 2025.
Toyota vehicles a common target for thieves
Toyota vehicles made up six of the 10 most stolen car models in Victoria in the year ending March 2026, according to Crime Statistics Victoria data. Along with the Toyota Corolla, the top 10 included the Toyota HiLux, RAV4, LandCruiser, Camry and Prado.
Several Toyota models recorded sharp year-on-year increases. Corolla thefts rose from 707 to 1,244, while RAV4 thefts more than doubled from 407 to 895. LandCruiser thefts also rose from 471 to 885, and Prado thefts increased from 272 to 496.
The top three changed year on year, with the Corolla moving from third to first, the Holden Commodore falling from first to second, and the Toyota HiLux moving from second to third. Toyota’s prominence on the list also reflects its presence on Victorian roads, with more than one million Toyota vehicles registered across the state.
More Toyota Prados but fewer HiAce models stolen
While the top three cars stolen in Victoria - the Commodore, Hilux and Corolla - remained the same in the years ending March 2025 and March 2026, there were notable differences between the two 12‑month periods.
The Toyota HiAce dropped from seventh to 12th place between the years ending September 2024 and September 2025, while the Prado climbed from 20th position in the year ending September 2024 to ninth in the year ending September 2025. Notably in early 2026, several Toyota vehicles, including the Prado and LandCruiser (which also cracked the top 10), were targeted by a crime syndicate with the intention of shipping the cars overseas.
The Nissan Pulsar and Volkswagen Golf also dropped off the top 10 in 2025, respectively falling to 17th and 11th positions.
The Toyota Hilux featured in the top 10 most stolen cars for the year ending March 2026.
The most stolen cars in Victoria
Table shows the top 10 vehicles stolen in Victoria in the year ending March 2026. Source: Crime Statistics Agency
Why are some cars being targeted?
Victoria Police says some thefts involve vehicles fitted with keyless ignition technology, which is more commonly found in mid- and top-spec newer cars than entry-level models.
These vehicles can be vulnerable because thieves may be able to access or start them without the physical key. Victoria Police reports that about one in five stolen vehicles is taken using this method.
The makes and models Victoria Police has identified include several vehicles that also appear in the most-stolen list, including the Holden Commodore, Toyota Corolla, Toyota HiLux, Toyota LandCruiser, Toyota RAV4, Toyota Camry and Toyota Prado.
Owners of these vehicles can help reduce the risk of theft by using an OBD port lock together with a steering wheel lock.
More: What is Stolen Vehicle Tracking and how can it help recover stolen cars?
Are thieves targeting electric vehicles?
Any vehicle can be targeted by thieves, and owners should take precautions to reduce the risk of motor vehicle theft.
The Tesla Model Y was Australia’s top-selling electric vehicle in 2024, 2025 and 2026. It does not appear in the Crime Statistics Victoria data shown for the year ending March 2026.
Crime Statistics Victoria data records two Tesla thefts in the year ending March 2026: one Model 3 vehicle and one Model S vehicle.
RACV Motoring Editor Terry Martin says some Tesla technologies may help reduce theft risk.
“Tesla vehicles can use their on-board cameras as part of Sentry Mode, which may record movement around the vehicle and alert the owner through the Tesla app,” Martin says.
“Other connected-car technologies available on Tesla vehicles and some other EVs include digital keys, where a driver can use a mobile phone as a key. Without a conventional physical key, some theft methods may be more difficult.
“When an EV is locked and charging, the charge cable is usually locked to the vehicle, which may make opportunistic theft more difficult while the car is plugged in.”
No electric vehicles (EVs) featured in the top 10 most stolen cars for the year ending March 2026, but owners should still take theft-prevention measures.
Where are cars being stolen from?
Data from CSV shows the street or footpath was the single most common location for motor vehicle theft in the year ending March 2026, with 10,275 thefts recorded - a 10 per cent increase on the year ending March 2025.
While this data may justify many motorists' perception of the street as the riskiest location to leave your vehicle, it shouldn't dissuade you from taking precautions when parked at home either.
Residential private dwellings were the second most common location from which vehicles were reported stolen, with 5,738 thefts recorded in the year ending March 2026.
Victorian councils where the most car thefts are occurring
In metropolitan Melbourne, the local government areas (LGAs or councils) that had the highest number of motor vehicle theft offences for the year ending March 2026 were:
- Casey (2137 thefts)
- Melbourne (1741 thefts)
- Hume (1716 thefts)
- Wyndham (1699 thefts)
- Greater Dandenong (1,334 thefts)
However, these LGAs all represent some of the largest and/or most populous councils in the metropolitan region. When adjusted for population over the same 12‑month period, a different picture emerges. When the data is broken down by the rate of thefts per 100,000 people in the LGA, the top councils for motor vehicle theft were:
- Maribyrnong (962.2 thefts per 100,000 people)
- Port Phillip (899.2 thefts per 100,000 people)
- Melbourne (890.5 thefts per 100,000 people)
- Greater Dandenong (792.2 thefts per 100,000 people)
- Yarra (685.5 thefts per 100,000 people)
The top locations for motor vehicle theft in Melbourne
| LGA | ||||
|---|---|---|---|---|
|
Casey |
2,137 |
1 |
495.8 |
16 |
|
Melbourne |
1,741 |
2 |
890.5 |
3 |
|
Hume |
1,716 |
3 |
591.7 |
11 |
|
Wyndham |
1,699 |
4 |
465.4 |
20 |
|
Greater Dandenong |
1,334 |
5 |
792.2 |
4 |
|
Brimbank |
1,296 |
6 |
651.5 |
8 |
|
Monash |
1,074 |
7 |
505.8 |
14 |
|
Darebin |
1,039 |
8 |
638.6 |
9 |
|
Whittlesea |
1,039 |
9 |
386.0 |
26 |
|
Port Phillip |
1,033 |
10 |
899.3 |
2 |
This table shows the top 10 metropolitan Melbourne LGAs with the highest number of recorded motor vehicle theft offences for the year ending September 2025. It presents both the total number of recorded offences and the corresponding LGA rate per 100,000 people, along with their respective rankings. Source: Crime Statistics Agency.
The Victorian regions recording the most motor vehicle theft
Regional areas experienced fewer motor vehicle thefts than metropolitan Melbourne, both in total incidents and in the rate per 100,000 people. The regional LGAs with the highest number of recorded motor vehicle theft offences for the year ending March 2026 were:
- Greater Geelong (939 thefts)
- Ballarat (847 thefts)
- Latrobe (492 thefts)
- Greater Bendigo (335 thefts)
- Greater Shepparton (323 thefts)
When adjusted for population over the same 12‑month period, the regional LGAs with the highest rate of motor vehicle theft per 100,000 people were:
- Ballarat (675.8 thefts per 100,000 people)
- Latrobe (616.6 thefts per 100,000 people)
- Pyrenees (542.5 thefts per 100,000 people). Number of recorded motor vehicle theft offences was 43.
- Mildura (475.0 thefts per 100,000 people). Number of recorded motor vehicle theft offences was 274.
- Northern Grampians (462.8 thefts per 100,000 people). Number of recorded motor vehicle theft offences was 55.
The top locations for motor vehicle theft in regional Victoria
| LGA | ||||
|---|---|---|---|---|
|
Greater Geelong |
939 |
1 |
312.0 |
39 |
|
Ballarat |
847 |
2 |
675.8 |
7 |
|
Latrobe |
492 |
3 |
616.6 |
10 |
|
Greater Bendigo |
335 |
4 |
261.9 |
48 |
|
Greater Shepparton |
323 |
5 |
459.6 |
22 |
|
Yarra Ranges |
298 |
6 |
184.7 |
61 |
|
Mildura |
274 |
7 |
475.0 |
18 |
|
Baw Baw |
203 |
8 |
316.9 |
37 |
|
Mitchell |
189 |
9 |
295.8 |
41 |
|
Moorabool |
176 |
10 |
428.3 |
25 |
This table shows the top 10 regional Victorian LGAs with the highest number of recorded motor vehicle theft offences for the year ending March 2026. It presents both the total number of recorded offences and the corresponding LGA rate per 100,000 people, along with their respective rankings. Source: Crime Statistics Agency.
How can I help prevent my car being stolen?
Always lock your vehicle
Keep your car locked at all times, including while driving. Do not leave your car unattended while running and always close all windows before walking away from your vehicle. Victoria Police also recommends you lock your car doors while driving.
Park off-street
Wherever possible, park your vehicle in a lockable garage or behind locked gates. It doesn't guarantee your car won't be stolen, but it does make it harder and can deter opportunism.
Don't leave items in your car
Take all valuables from your vehicle, even if just running into the shops. Avoid leaving bags in your car, even if they don't contain valuables, as this can tempt thieves.
Use a steering wheel or OBD-port lock
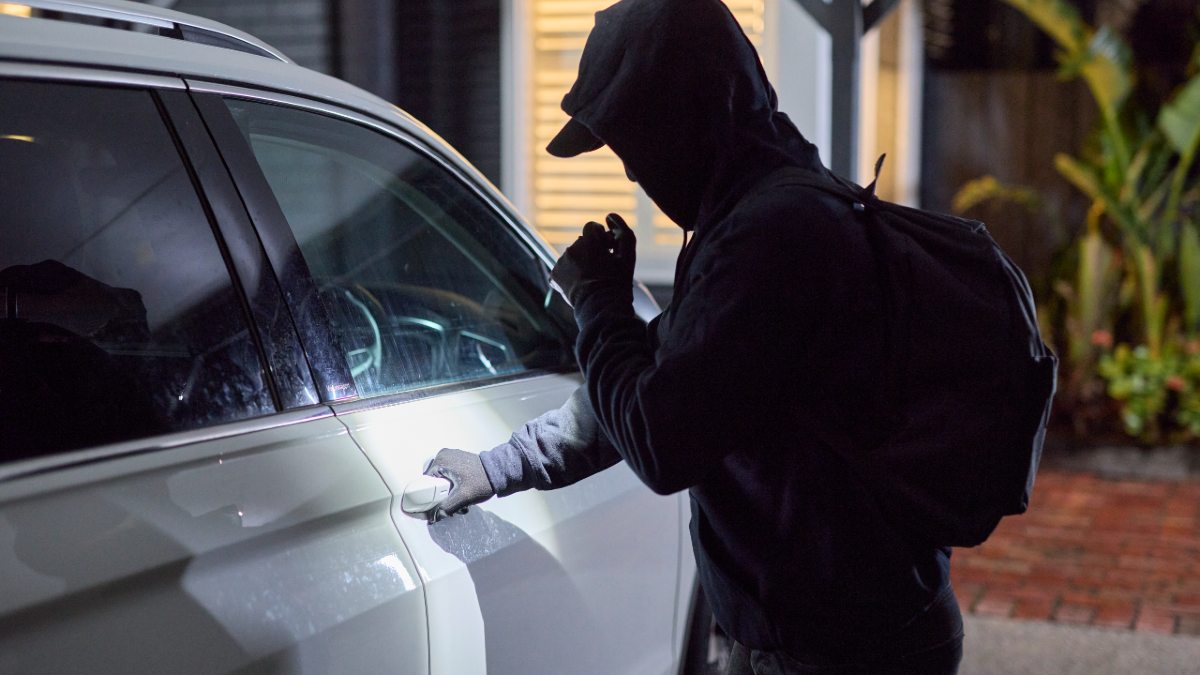
Steering wheel locks can help deter opportunistic thieves, while an OBD port lock can stop thieves from electronically accessing cars with keyless ignition.
Store your keys somewhere safe and away from your vehicle
Leaving your car keys right next to your front door can provide easy access for thieves, who can even 'bounce' the signal from the key fob to open your car remotely. Store your keys away from your car and consider a radio frequency identification (RFI) blocking storage container, such as a Faraday bag or box.
More: What is a Faraday bag and how can it help prevent car theft?
What car security features should buyers look for?
For those in the market for a new car, security should sit alongside price, fuel efficiency and safety when comparing models. Research and comparison tools that allow buyers to compare features across vehicles can help highlight where security protections differ between models.
The information provided is general advice only. Before making any decisions please consider your own circumstances and the Product Disclosure Statement and Target Market Determinations. For copies, visit racv.com.au. As distributor, RACV Insurance Services Pty Ltd AFS Licence No. 230039 receives commission for each policy sold or renewed. Product(s) issued by Insurance Manufacturers of Australia Pty Ltd ABN 93 004 208 084 AFS Licence No. 227678.

